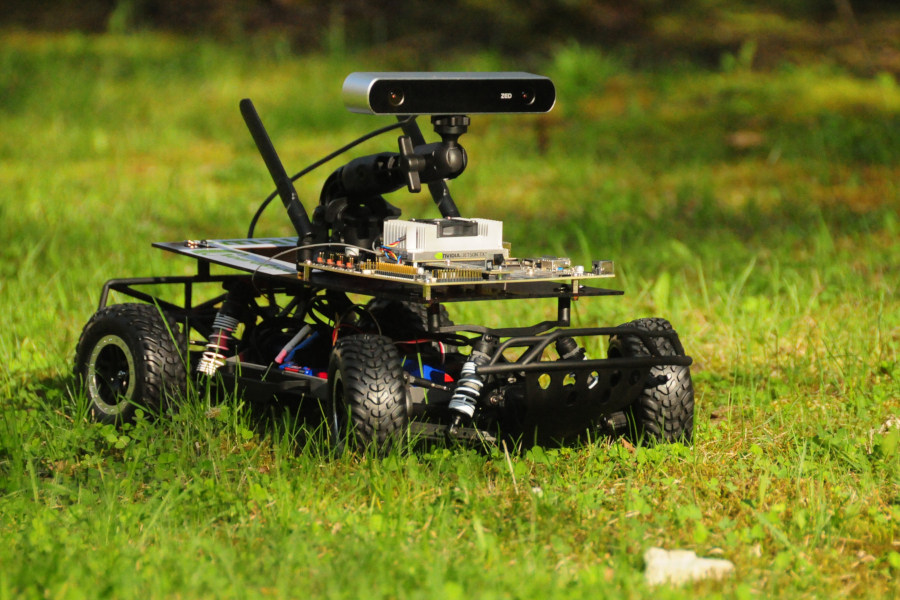
Fourier Showcase

A small utility program in Python (pygame + numpy) to visualize the fourier transformation, executed in browser using pyodide.

Try it out!

The left side shows a list of float values.

The right side shows the resulting spectrum after a fourier transformation.

Changing the samples/spectrum

To change the spectrum just click on it and move the cursor around. Left click will set the real part, right click the imaginary part.

There are also some predefined spectrums that can be set by pressing the following keys: